Stats Server
Statistic analysis
Statistic analysis is the treatment of data collected through an amount of time with research, monitorization, prediction and error detection purposes.
Computers can measure variables in a way it would be impossible for humans thanks to sensors.
A traditional statistical analisis requires 6 main steps.
- Data
- Variables
- Estimation
- Statistics
- Testing
- Analisis & Representation
Data
There are 2 main data types.
- Cross-Sectional Data; Collection of observations for multiple individuals at a single point in time (time stamp).
- Time Series Data; Collection of observations for a single individual at different time intervals.
Combining both another type can be obtained;
- Panel/Longitudinal Data; Collection of observations for multiple individuals at multiple time intervals.
The requirements to obtain Panel Data are the following.
- Every individual time intervals are measured for the same amount of time.
- Every individual have the same time spacing between each sample [1] .
Considering X as the subject under analysis, i as an individual and t as a point in time, given a constant value to X.
- In Cross-Sectional Data, i is a variable and t is a constant
- In Time Series Data, t is variable and i is a constant
- In Panel Data, t and i are variables
Depending on the data we can obtain different results;
- Comparing the behaviour of multiple individuals over a single point in time. Predict based on multiple individuals (individuals have differences and similarities between each others which makes relations).
- Comparing the behaviour of a single individual over multiple points in time. Predict based on older results.
- Comparing the behaviour of multiple individuals over multiple points in time. Predict based on multiple individuals and older results.
Variables
There are 2 types.
- Qualitative; Descriptions expressed as words. Values without any precission or range and unknown before the study.
- Quantitative; Measures expressed as numbers. Values with a defined precission and range and known before the study.
We can obtain also different results.
- Structured; Used to obtain high-precission values.
- Unstructured; Used to discover people opinions or thoughts over a subject.
Estimation
It’s a complex part of statistics based on margins of error and the level of confidence. Since im working with a computer, the margins of error depend on the sensors, precission of the programs that give the metrics and the Unix epoch time precission. The level of confidence is considered plenty.
Statistics
It’s the part that consists in processing the obtained data applying mathematical functions in order to obtain descriptive results.
Analysis & Representation
It’s the part that a person analyzes the given results to come to a conclusion and show them as a graphic or table in the most suitable and explanatory way.
Deployment
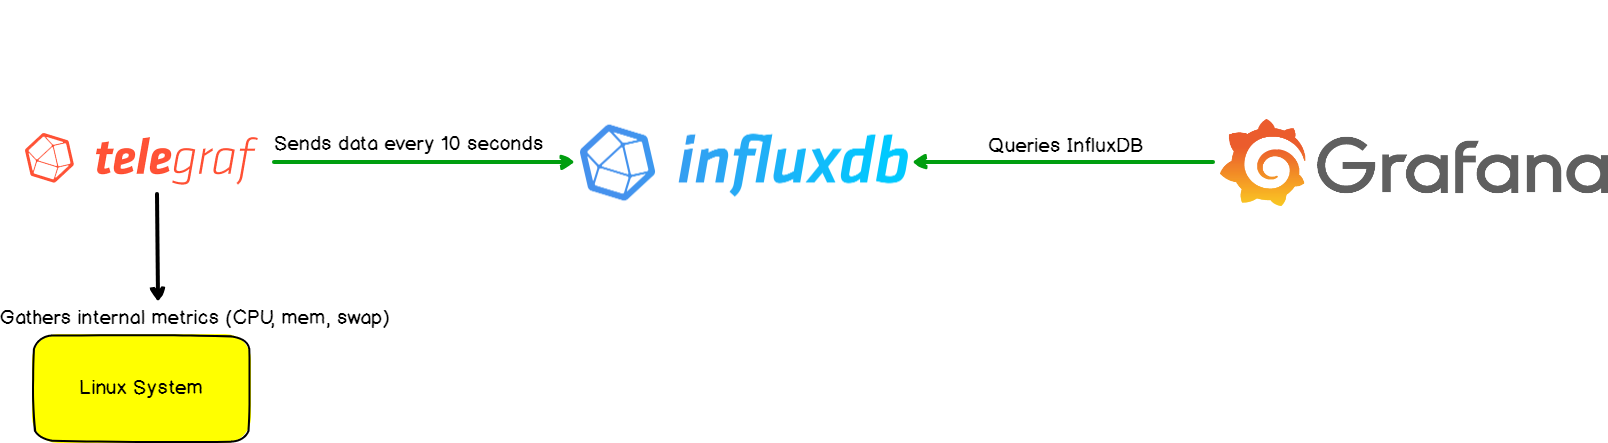
The statistics stack architecture I created is composed of 3 main technologies.
- Telegraf & PVEStatd; Data collector
- InfluxDB; Time-series database
- Grafana; Graphic metrics visualizer
Compared with a traditional statistical analysis.
- Data; Telegraf & PVEStatd
- Variables; Quantitative focused to structured results
- Estimation; As explained before
- Statistics; InfluxDB
- Testing; Applied before and during production
- Analisis & Representation; Grafana
The statistics stack will be deployed in 2 LXCs and the host machine. Security here is not an important fact because im only going to treat with the MasterServer stats, which means data is not sensible at all.
Footnotes
| [1] | Single data measure of a single individual at a single point in time |